U.S. Stock Market Returns Around Thanksgiving
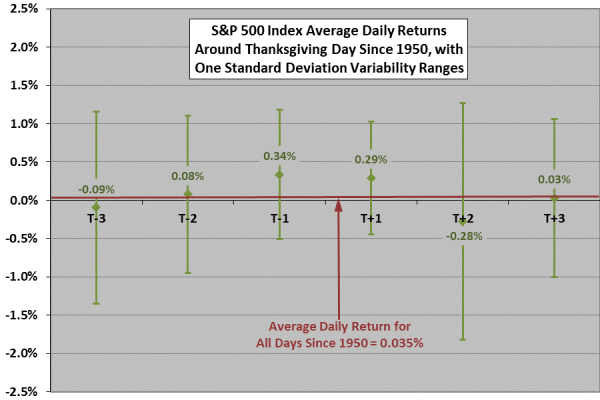
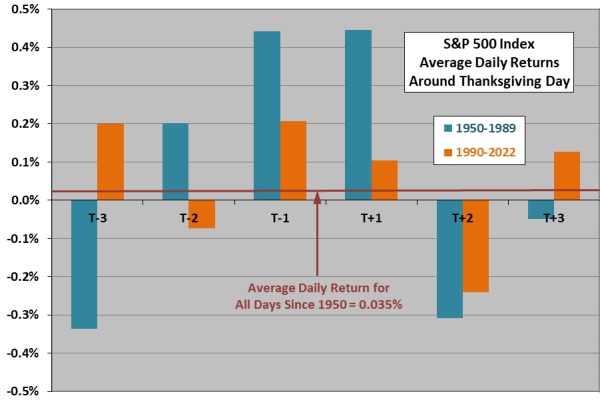
(…) The following chart shows average daily S&P 500 Index returns for the three trading days before (T-3 to T-1) and the three trading days after (T+1 to T+3) Thanksgiving over the full sample period, with one standard deviation variability ranges. The average daily return for all trading days in the sample is 0.035%. Results suggest: Strength and low volatility during the trading days just before and just after Thanksgiving. Weakness and high volatility the second trading day after Thanksgiving. (…)
Link: https://www.cxoadvisory.com/calendar-effects/stock-returns-around-thanksgiving/

